
Mastering Content Performance Metrics
Content performance metrics are simply the numbers you track to see if your content is actually doing its job. Think of them as a report card for every article, video, or social media post you create. They tell you what's a hit, what's a miss, and most importantly, why.
Why Content Performance Metrics Matter

Imagine you throw a huge party. You’ve planned everything—the food, the music, the decorations. But you never talk to a single guest to see if they’re having a good time. Afterwards, you'd have no clue what people actually enjoyed or what you should do differently next time.
Creating content without looking at the data is exactly the same. You're just throwing stuff out there, hoping for the best. Content performance metrics are your feedback loop, telling you what your audience really thinks.
These numbers are what turn content creation from a purely creative, "I hope this works" activity into a real business driver. They give you the objective proof you need to make smart decisions, show your value, and build a strategy that actually moves the needle.
Moving Beyond Busywork
It's easy to get caught up in the content hamster wheel, confusing activity with real progress. Pumping out five blog posts a week might feel productive, but if none of them bring in traffic or leads, what's the point? Metrics help you separate what's just busywork from what's truly making an impact.
By focusing on the right metrics, you can shift your efforts from simply producing more content to producing the right content—the kind that resonates with your audience and supports your business objectives.
This data-driven approach is how you justify your marketing budget and prove your ROI to the higher-ups. It’s the difference between guessing what your audience wants and knowing what they respond to.
The Foundation of a Successful Strategy
Getting a solid handle on your content performance metrics is the bedrock of any smart marketing plan. It allows you to:
- Identify Top Performers: Find out which articles, videos, or posts are your heavy hitters so you can double down on what’s working.
- Diagnose Underperforming Content: Figure out why some pieces fall flat and learn how to either fix them or just let them go.
- Optimize Your Customer Journey: See how your content helps guide people from just discovering you to becoming a paying customer, so you can smooth out the path.
When you track these indicators, you’re not just counting clicks. You’re gathering the intelligence you need to build a smarter, more efficient content engine. For a closer look at the specific numbers that can define your strategy, our guide on essential content marketing metrics is a great place to start. Getting this part right sets the stage for everything else.
A Simple Framework for Measuring Content
To make sense of all the data out there, you need a simple framework. Without one, you’re just swimming in a sea of numbers with no direction. A good framework helps you organize your content performance metrics into a clear story, showing you exactly how people find your content, interact with it, and ultimately take action.
Think of it like building a house. You can't put up the walls without a solid foundation, and you certainly can't add a roof without the walls. Each step builds on the last. A measurement framework gives your content that same logical structure.
This infographic breaks down the essential pillars of content performance, giving you a visual map of the journey from the first click to the final sale.
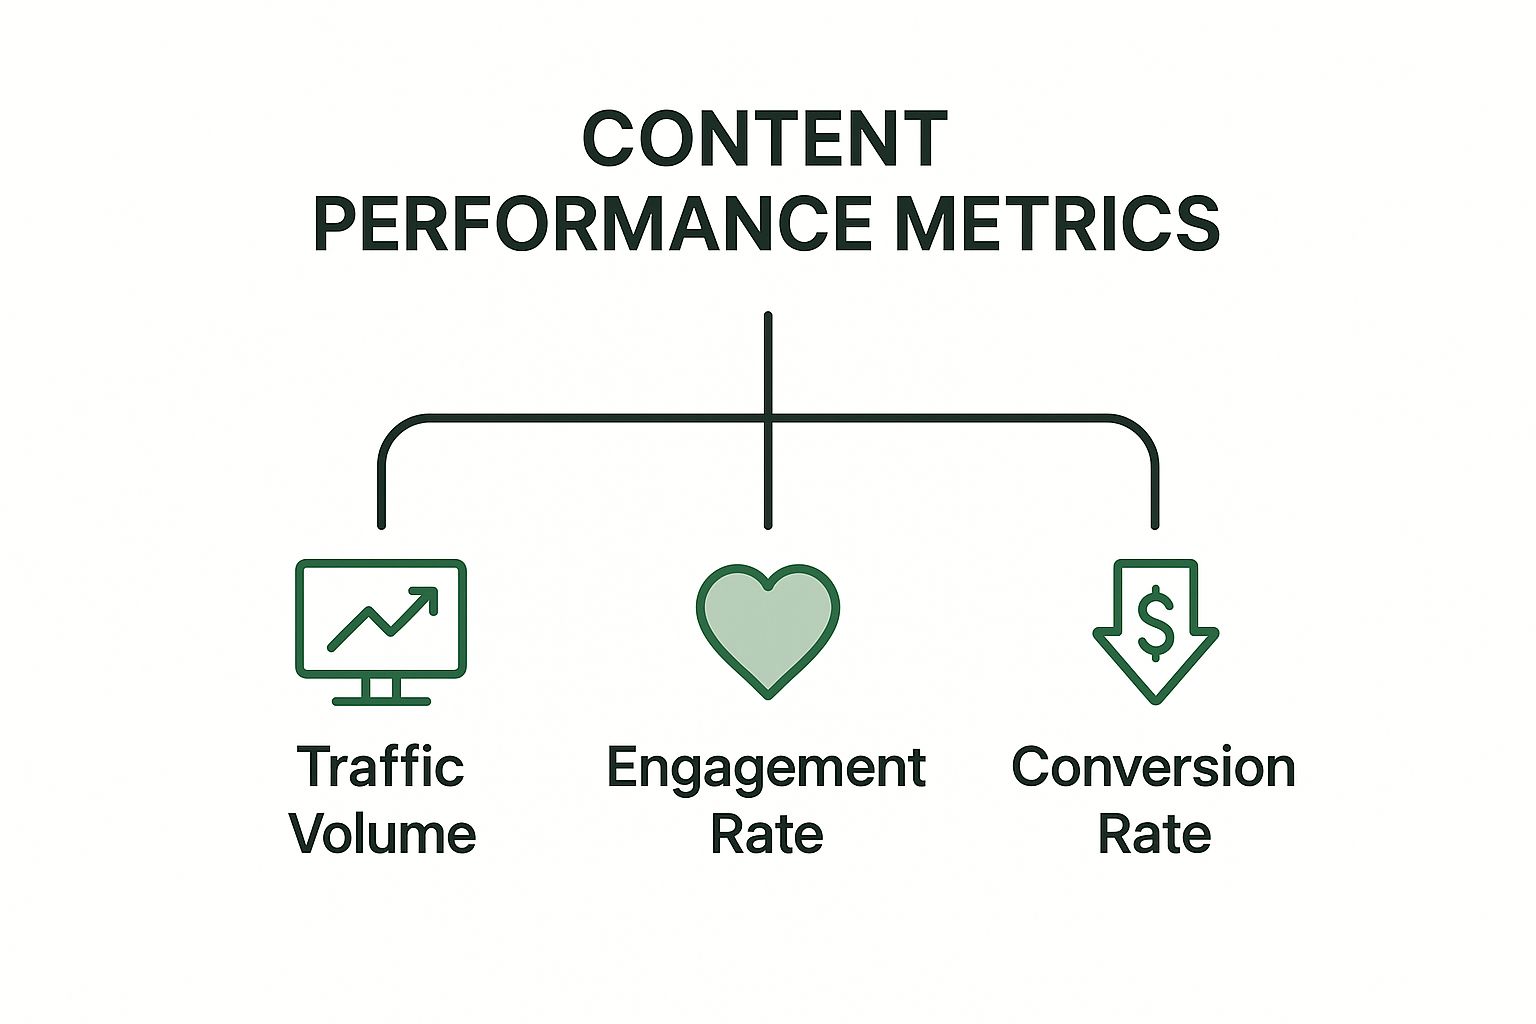
As you can see, everything starts with high-level traffic metrics. From there, you can dig deeper into engagement and, eventually, track the conversions that really matter to your business.
The Four Pillars of Content Measurement
A really effective way to look at this is through four key pillars. This model keeps things simple and helps you see the full picture of your content's impact from beginning to end.
- Consumption: This is the top of the funnel. It answers the basic question: "Are people seeing my content?" Here, you're looking at metrics like page views and unique visitors to gauge reach.
- Engagement: Once people land on your content, what happens next? Do they stick around? Engagement metrics like time on page, scroll depth, and social shares tell you if your content is actually hitting the mark.
- Retention: This pillar is all about loyalty. Are people coming back for more? Things like returning visitor rates and newsletter sign-ups show that you're building a real audience that values what you have to say.
- Conversion: This is the bottom line. It’s where your content connects directly to business goals. Did your content lead to a sale, a demo request, or a qualified lead? This is where the magic happens.
By organizing your analysis around these four pillars, you stop just looking at data and start understanding the story behind it. You can see exactly where your strategy is winning and where it needs a little work.
Choosing Your Tools and KPIs
With this framework in place, you can pick the right Key Performance Indicators (KPIs) for each pillar. When setting up your measurement system, it pays to look into specialized tools. For example, if you rely heavily on visual platforms, checking out the best Pinterest analytics tools can give you specific insights into your consumption and engagement there.
The key is not to track every single metric under the sun. That’s a recipe for analysis paralysis. Instead, focus on a primary KPI for each piece of content. Maybe it's lead generation for a new landing page or average engaged time for a deep-dive blog post. This approach keeps your analysis focused and ensures every piece of content has a clear job to do.
Tracking Your Content's Reach and Visibility
Before we dive into engagement, conversions, or ROI, we have to start with the most basic question: is anyone actually seeing what you’ve created? This is the job of reach and visibility metrics. They’re your first checkpoint, a quick health check to see if your content is even discoverable in the first place.
Think of it like this: these metrics are the turnstiles at the entrance of your amusement park. They don't tell you which rides people loved, but they give you a solid headcount of who walked through the gates. Without that initial crowd, none of the other content performance metrics mean a thing.
Core Consumption Metrics Explained
At the heart of measuring reach are a few core numbers that, when understood correctly, paint a clear picture of your audience size. It's easy to get them mixed up, but their differences are what give you real insight.
Here’s a simple breakdown of the essential metrics you'll want to keep an eye on:
| Metric | What It Measures | Why It Matters |
|---|---|---|
| Page Views | The total number of times a page was loaded in a browser. | It’s a raw measure of popularity and a basic signal of how far your content is spreading. |
| Unique Visitors | The number of distinct individuals who viewed your content in a given period. | This tells you the actual size of your audience, filtering out repeat visits from the same person. |
| Impressions | How many times your content was displayed to users (e.g., in search results or social feeds). | This shows your content's potential reach, even if users didn't click through. |
These numbers give you a fantastic high-level overview. But their real power is unlocked when you start tracking trends. A sudden spike in page views might mean you've got a viral hit on your hands, while a slow, steady decline could be a red flag that your content is losing its search ranking.
Understanding Where Your Audience Comes From
Knowing how many people see your content is only half the story. The other, arguably more important half is knowing where they came from. Traffic sources tell you which channels—like Google search, social media, or your email newsletter—are actually working to bring people to your content.
Analyzing your traffic sources is like being a detective. By understanding where your visitors came from, you can retrace their steps and discover which paths are leading them to your doorstep. This lets you double down on what works and fix what doesn't.
Page views are a fundamental metric, but they can be misleading on their own. For example, a high number of page views with a very low time on page might just mean your title was catchy but your content didn't deliver. That's why it's crucial to combine metrics for a comprehensive view.
Once you've confirmed that your content is visible and reaching people, you can move on to the next, more interesting question: are they actually paying attention?
Measuring What Really Matters: Audience Interaction
Knowing your content reached people is one thing, but it’s only the first step. The real question is: what did they do next? Did they just glance at your headline and bounce, or did they actually lean in, read, and connect with your message? This is how you find out if you have a passive audience or a truly engaged one.
Think of it like this: a view is someone walking past your storefront. An interaction is someone stopping, coming inside, and actually looking around. These deeper metrics tell you not just if people showed up, but whether they cared enough to stick around. They're the clearest signs that your content is hitting the mark and building loyalty.
Moving Beyond the Click
To get a real sense of connection, you have to look at metrics that show genuine user behavior and attention. These numbers paint a much clearer picture of how compelling your content is, going far beyond simple clicks or page views.
Here are a few key metrics that signal real interaction:
- Average Engaged Time: This isn't just about how long a page was open. It tracks how long people were actively scrolling, clicking, and moving their mouse. It’s a fantastic indicator that you’ve captured their attention.
- Scroll Depth: How far down the page did most people actually get? If 80% of your visitors never make it past the first paragraph, you know right away your introduction isn't doing its job.
- Comments and Replies: This is community in action. When someone takes the time to type out a thought or a question, it means your content has sparked a real conversation.
- Social Shares: A share is a powerful personal endorsement. It means a user found your content so useful or interesting that they were willing to attach their name to it and pass it along.
By focusing on the quality of these interactions, not just the quantity, you get a much better feel for how to build real relationships. For a closer look at these interactions on specific platforms, our guide to social media analytics can help.
The Power of Tracking Attention
Newer, more advanced metrics are changing the game. Instead of just counting how many times a page was loaded, they measure the actual time your audience spends actively interacting with your work. Total engaged minutes, for example, adds up all the active time every visitor spent with your content. This gives you a rich, historical view of what resonates and keeps people coming back. You can discover more about how engaged time metrics work and see how they can sharpen your strategy.
Think of it this way: page views tell you how many people knocked on your door. Engaged time tells you how many came in, sat down, and stayed for a real conversation.
When you track these signals, you learn exactly what your audience loves. A blog post with high engaged time and a lively comment section gives you a perfect blueprint for your next piece. This feedback loop is the key to building an audience that doesn't just see your content, but truly values it.
How to Connect Content to Business Growth

Sure, likes and shares feel good, but this is where the rubber really meets the road. Tying your content performance directly to business growth is how you prove your work has a tangible return on investment (ROI). It's what turns "Lots of people read our blog" into "Our blog generated $50,000 in new revenue last quarter."
Think of your content as the breadcrumbs leading a potential customer through the woods. The destination isn't just a comment or a share—it's a real business outcome. This is the final step that connects your marketing efforts to the company's bottom line.
From Reader to Paying Customer
To track that journey from a curious blog reader to a happy paying customer, you need to focus on conversion metrics. These are the specific actions that show someone is getting serious about what you offer. They're the clearest signs of content success because they connect directly to revenue.
A few key conversion metrics to watch are:
- Lead Generation: How many people read a blog post and then filled out a form to download your new ebook, sign up for a webinar, or request a product demo?
- Newsletter Sign-ups: This is a big one. It means you're building an audience you can talk to directly, anytime you want.
- Sales Attributed to Content: This is the ultimate prize. Can you trace a sale back to a specific article, video, or guide?
The goal is to create a clear, traceable path from the first click on a piece of content to the final handshake with a new customer. This journey is what justifies your content marketing budget and proves its value in the most undeniable way.
Speaking the Language of the C-Suite
To really get the attention of leadership, you have to frame your results in a way they understand. This means connecting your content wins to high-level business goals. Think Customer Acquisition Cost (CAC) and Customer Lifetime Value (CLV).
Here's how content plays a role:
- Customer Acquisition Cost (CAC): How much does it cost to get a new customer through your content marketing compared to, say, paid ads? Great content almost always brings this cost down.
- Customer Lifetime Value (CLV): Does your content attract customers who spend more and stick around longer? Tracking this shows you aren't just bringing in any leads, but the right kind of leads.
To get these numbers right, you need solid tracking in place. For any paid campaigns, robust Google Ads conversion tracking is a must. It’s also smart to align these efforts with your social media goals, which you can learn more about by reviewing the right https://publora.com/blog/social-media-kpis to monitor.
When you can walk into a meeting and show that your content is lowering CAC and increasing CLV, you stop being seen as "just a marketer." You become a strategic driver of the business's growth.
Here’s the rewritten section, designed to sound like an experienced expert sharing their practical advice.
Your Action Plan for Better Content Measurement
Alright, let's get practical. Knowing your numbers is one thing, but turning that data into real-world improvements is where the magic happens. This is your playbook for building a simple, repeatable system that actually makes your content better over time.
Think of it like this: a great chef doesn't just taste the soup once. They taste it, get feedback, and then tweak the recipe until it's perfect. Your action plan is how you do that with your content—constantly refining, not just measuring for the sake of it.
Setting Up Your Measurement Dashboard
First things first, you need a single source of truth. A content dashboard doesn't have to be some overly complicated, expensive tool. Honestly, a well-organized spreadsheet works just fine to get started. The goal is simply to get your most important metrics in one place.
For every major piece of content or campaign, you should be able to see your main goal at a glance. Is it lead form submissions? Track that. Then, add a few secondary metrics to give it context, like page views or bounce rate. This simple setup will instantly show you what’s hitting the mark and what’s falling flat.
An effective dashboard isn't about cramming every possible metric onto one screen. It's about focusing on the right metrics—the ones that connect what you're creating to what the business actually needs to achieve.
A Checklist for Regular Content Reviews
Once your dashboard is live, you need to build a habit of actually looking at it. A consistent review schedule is what separates the pros from the amateurs. It helps you spot problems early and jump on opportunities before they disappear.
Here’s a simple rhythm that works wonders:
Weekly Check-in (15-30 minutes):
- The Winners: What content drove the most traffic or engagement this week?
- Red Flags: Notice any weird spikes or sudden drops in key metrics? Why did that happen?
- Top Channels: Where did our best traffic come from? Organic search? A specific social media post?
Monthly Strategic Review (1 hour):
- Goal Check: Are we on track to hit our bigger monthly or quarterly goals, like new leads or trial sign-ups?
- Spotting Trends: What patterns are popping up? Are blog posts on a certain topic always doing better? Do videos get more shares?
- Next Steps: Based on everything we've learned, what are we going to do differently next month?
This two-part approach keeps you on top of the day-to-day stuff while making sure you don't lose sight of the big picture. By making this a regular practice, you create a powerful feedback loop that consistently fuels better results and proves the value of your work.
Frequently Asked Questions About Content Metrics
Even with the best plan, you're going to have questions once you start digging into your content data. That's completely normal. The good news is that understanding content performance metrics is usually more straightforward than it seems.
Let's clear up some of the most common questions we hear. These aren't just textbook definitions; they're practical answers to help you measure what truly matters and build a content strategy that actually works.
Which Content Metrics Are Most Important?
This is the big one, and the honest-to-goodness answer is: it depends entirely on your goal. There's no single metric that rules them all. The right metric is the one that directly measures the specific outcome you're aiming for.
Think of it like this: you wouldn't use a hammer to saw a board in half. In the same way, you wouldn't judge a brand awareness video by how many sales leads it generated. The tool has to match the job.
To keep it simple, just tie your metrics to your content's main purpose:
- For Brand Awareness: Your job is to get in front of as many relevant people as possible. Focus on metrics like Page Views, Unique Visitors, and Social Reach. These tell you how many pairs of eyeballs saw your stuff.
- For Community Building: Here, you want to see that people are actually interacting with you. Look at metrics like Average Engaged Time, Comments, and Shares. These are signs that your audience genuinely cares.
- For Lead Generation: This is all about driving a specific action. You'll want to track conversion metrics like Form Fills, Demo Requests, or CTA Click-Through Rates. These directly connect your content to business results.
The best approach is to pick one primary metric that aligns with your main goal (like leads) and two or three secondary metrics that add context (like page views and scroll depth). This keeps you focused without losing sight of the bigger picture.
What Are The Best Tools For Tracking Metrics?
You really don't need a massive budget or a complicated tech stack to get started. In fact, some of the most powerful tools out there are free. The trick is to start simple and only add more specialized tools as your needs evolve.
A fantastic starter toolkit would include:
- Google Analytics 4 (GA4): This is non-negotiable. GA4 is the industry standard for understanding website traffic, what people do on your pages, and where they come from. It’s the bedrock of any good measurement system.
- Native Social Media Analytics: Every platform—from Meta Business Suite and LinkedIn Analytics to TikTok Analytics—gives you its own dashboard packed with data. Use these to see how your content performs within each specific social network.
- Heatmap and Engagement Tools: Want to see exactly how people use your pages? Tools like Hotjar or Clarity give you visual heatmaps and scroll maps, showing you where people click and how far down the page they actually read.
- Customer Relationship Management (CRM): To connect content to real money, you need a CRM like HubSpot or Salesforce. This is how you can finally track a person's entire journey, from the first blog post they read to the day they become a paying customer.
Start with GA4 and the native social tools. Once you're comfortable with those, you can layer in more advanced platforms to get a richer view of user behavior and truly prove your content's ROI.
How Often Should I Review My Content Performance?
Setting a consistent review schedule is the key to turning your data into meaningful action. If you only check your numbers once a quarter, you're flying blind and missing opportunities. But checking them every hour is a recipe for anxiety.
A tiered approach tends to work best, giving you the right balance of quick reactions and big-picture strategy.
- Daily or Real-Time Checks: This is just a quick, five-minute scan of a high-level dashboard. You're simply looking for anything out of the ordinary—a sudden traffic spike from a post going viral or a scary drop that might signal a technical problem.
- Weekly Reviews: Set aside 30 minutes each week to go a little deeper. Look at what content is performing best, check your engagement trends, and see how many leads you're generating. This is where you make small, smart adjustments to your content plan.
- Monthly or Quarterly Reports: This is your strategic sit-down. You zoom out to look at progress toward your major goals, overall ROI, and what you’ve learned. This report is less about raw data and more about the story the numbers are telling.
This system ensures you’re always on top of what's happening right now while never losing sight of your long-term goals.
Ready to streamline your content creation and scheduling? Publora brings all your social media management into one place, saving you hours every week. Plan, create, and publish content effortlessly across eight major networks with our intuitive dashboard and AI-powered tools. Start your free 14-day trial and see the difference.